Sequim Bay Operational Forecast System (SBOFS)
Model Details
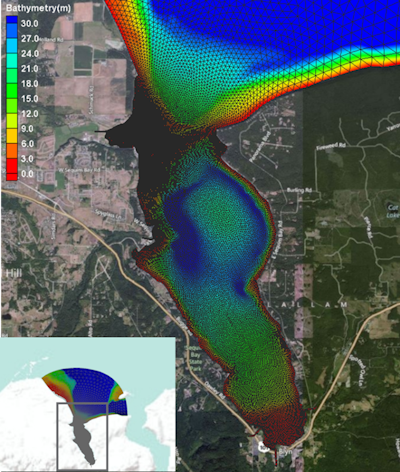
Sequim Bay model grid and bathymetry
The Sequim Bay Operational Forecast System (SBOFS) has been developed using the unstructured-grid, Finite-Volume Community Ocean Model (FVCOM) (Chen et al. 2003) to predict the circulation and water properties in Sequim Bay.
To accurately predict the hydrodynamic conditions in Sequim Bay and efficiently resolve the complex bathymetric features, a high-resolution model grid was developed for SBOFS based on criteria such as bathymetry gradient, shoreline, and enhanced resolution for the inlet. The final grid resolution (in terms of triangular element side length) varies from ~500 m along the open boundaries in the Strait of Juan de Fuca to <10 m inside the Sequim Bay inlet. The entire mesh consists of approximately 16,000 vertices and 31,000 triangle elements. To resolve the vertical structure of the circulation field, 10 uniform terrain-following, sigma layers were implemented. The model bathymetry was interpolated from National Oceanic and Atmospheric Administration's Puget Sound 1/3 arc-second (~10 m resolution) coastal digital elevation model that covers the entire model domain, and was updated for areas covered by a recent high-resolution (1.5 m) multibeam bathymetric survey in Sequim Bay (C & C Technologies, 2015).
SBOFS is driven by following forcing mechanisms:
- Open boundary conditions: Hourly model output from the University of Washington's LiveOcean at its open boundaries in the Strait of Juan de Fuca. The open boundary forcing variables include spatially varying water level, temperature, and salinity field.
- Sea surface boundary conditions: Meteorological forcing for the model is specified using 3-hourly model output from the Global Forecast System (GFS), including variables such as wind, atmospheric pressure, shortwave and longwave heat fluxes, atmospheric temperature, and relative humidity.
- River boundary conditions: Freshwater input via several small creeks discharging into the bay is also included in the model based on forecasted river discharge information from Northwest River Forecast Center.
SBOFS has been running daily on PNNL's supercomputer to provide automatic 3-day forecasts since April 2022. The daily files with hourly outputs for a full suite of hydrodynamic variables covering the entire model domain are archived and available upon request by emailing mcrldata@pnnl.gov.