MCRLdata Historic Trends
To improve access to MCRLdata historic data, files were downloaded and reviewed for all data collected through May 2025. These files were made publicly avaiable along with R visualization scrits on the MCRLdata Sandbox. Some analysis was also done of seasonality, natural variability, and carbonate chemistry.
Sequim Bay Seasonality
This markdown provides a brief summary of seasonal patterns for a range of parameters deemed of most use to boating ops, but also of potential use to various research activities. This content is targeted to folks familiar with the system, but with just enough detail that folks not familiar will hopefully understand.
Water Levels
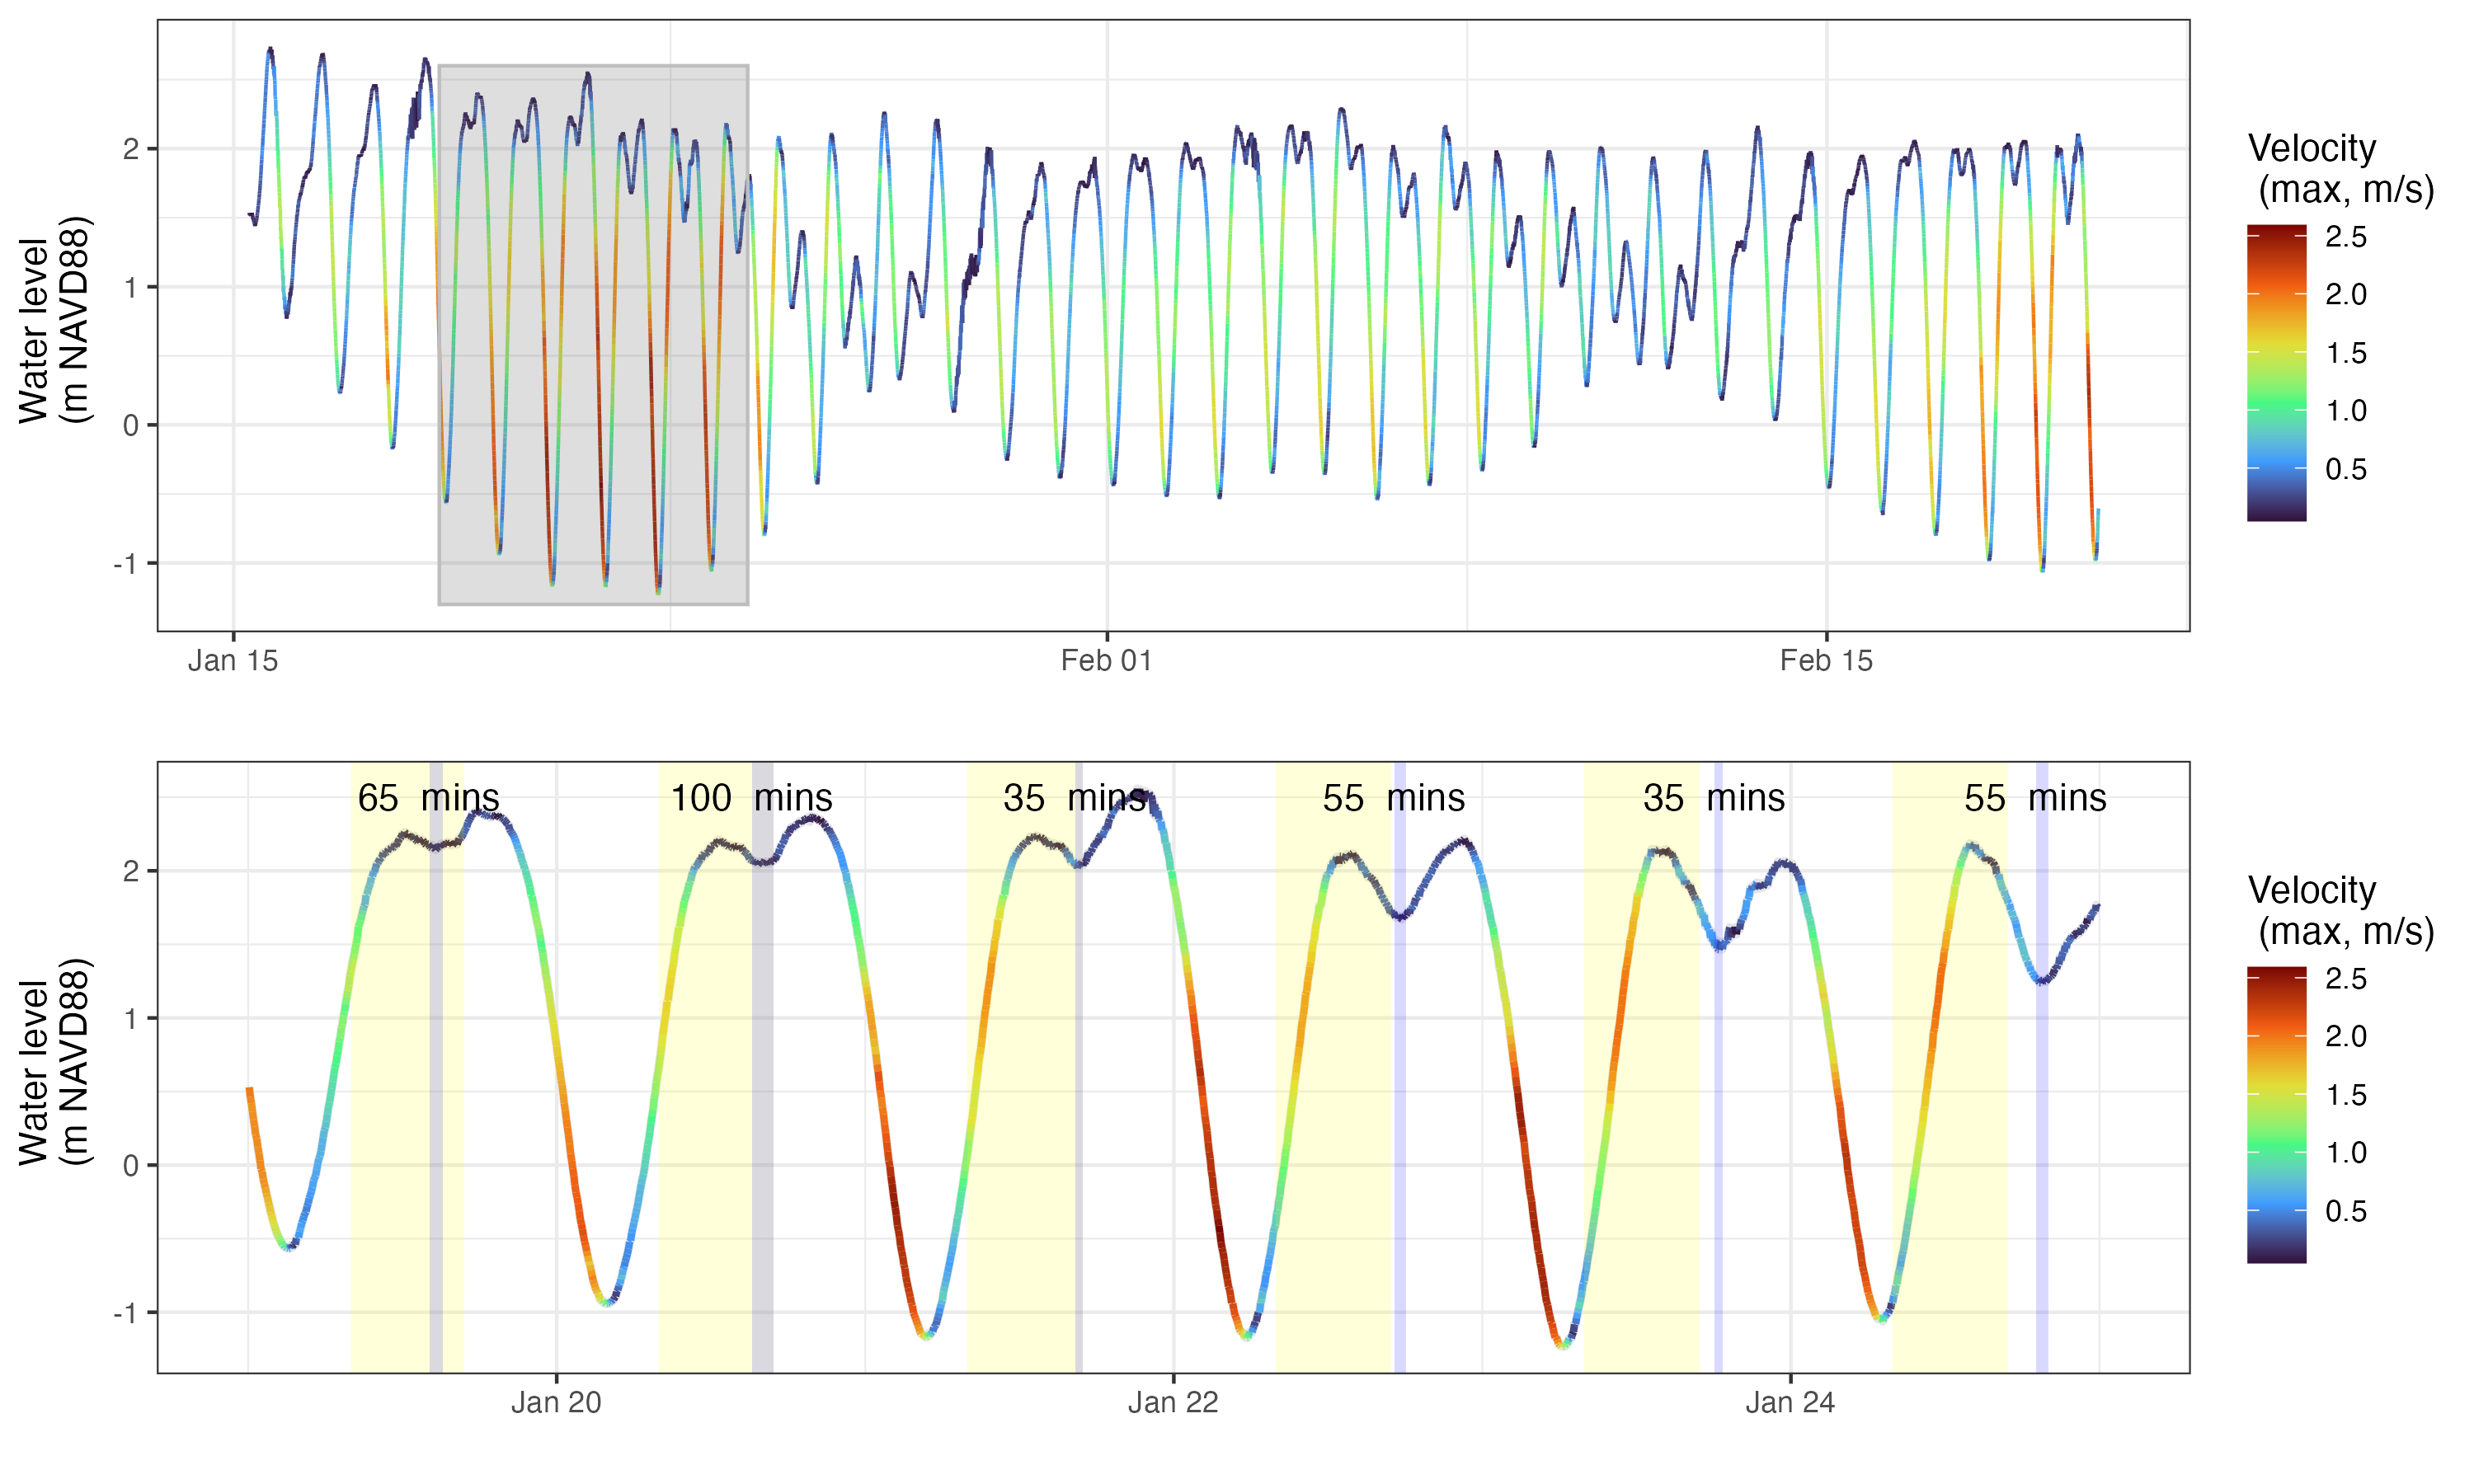
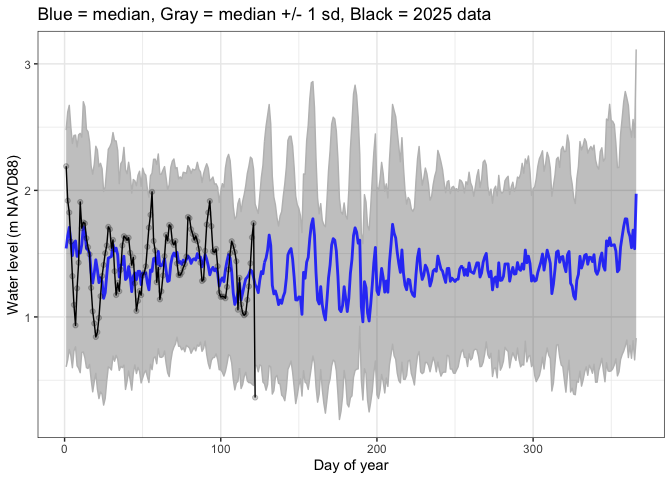
Tides in Sequim Bay are semi-diurnal, meaning two high tides per day, but this pattern is often muted such that tides appear closer to diurnal. Water levels change roughly 2-3 meters between high and low tides, though this varies considerably between spring tides. Ebb tides are strongest in the channel to Sequim Bay.
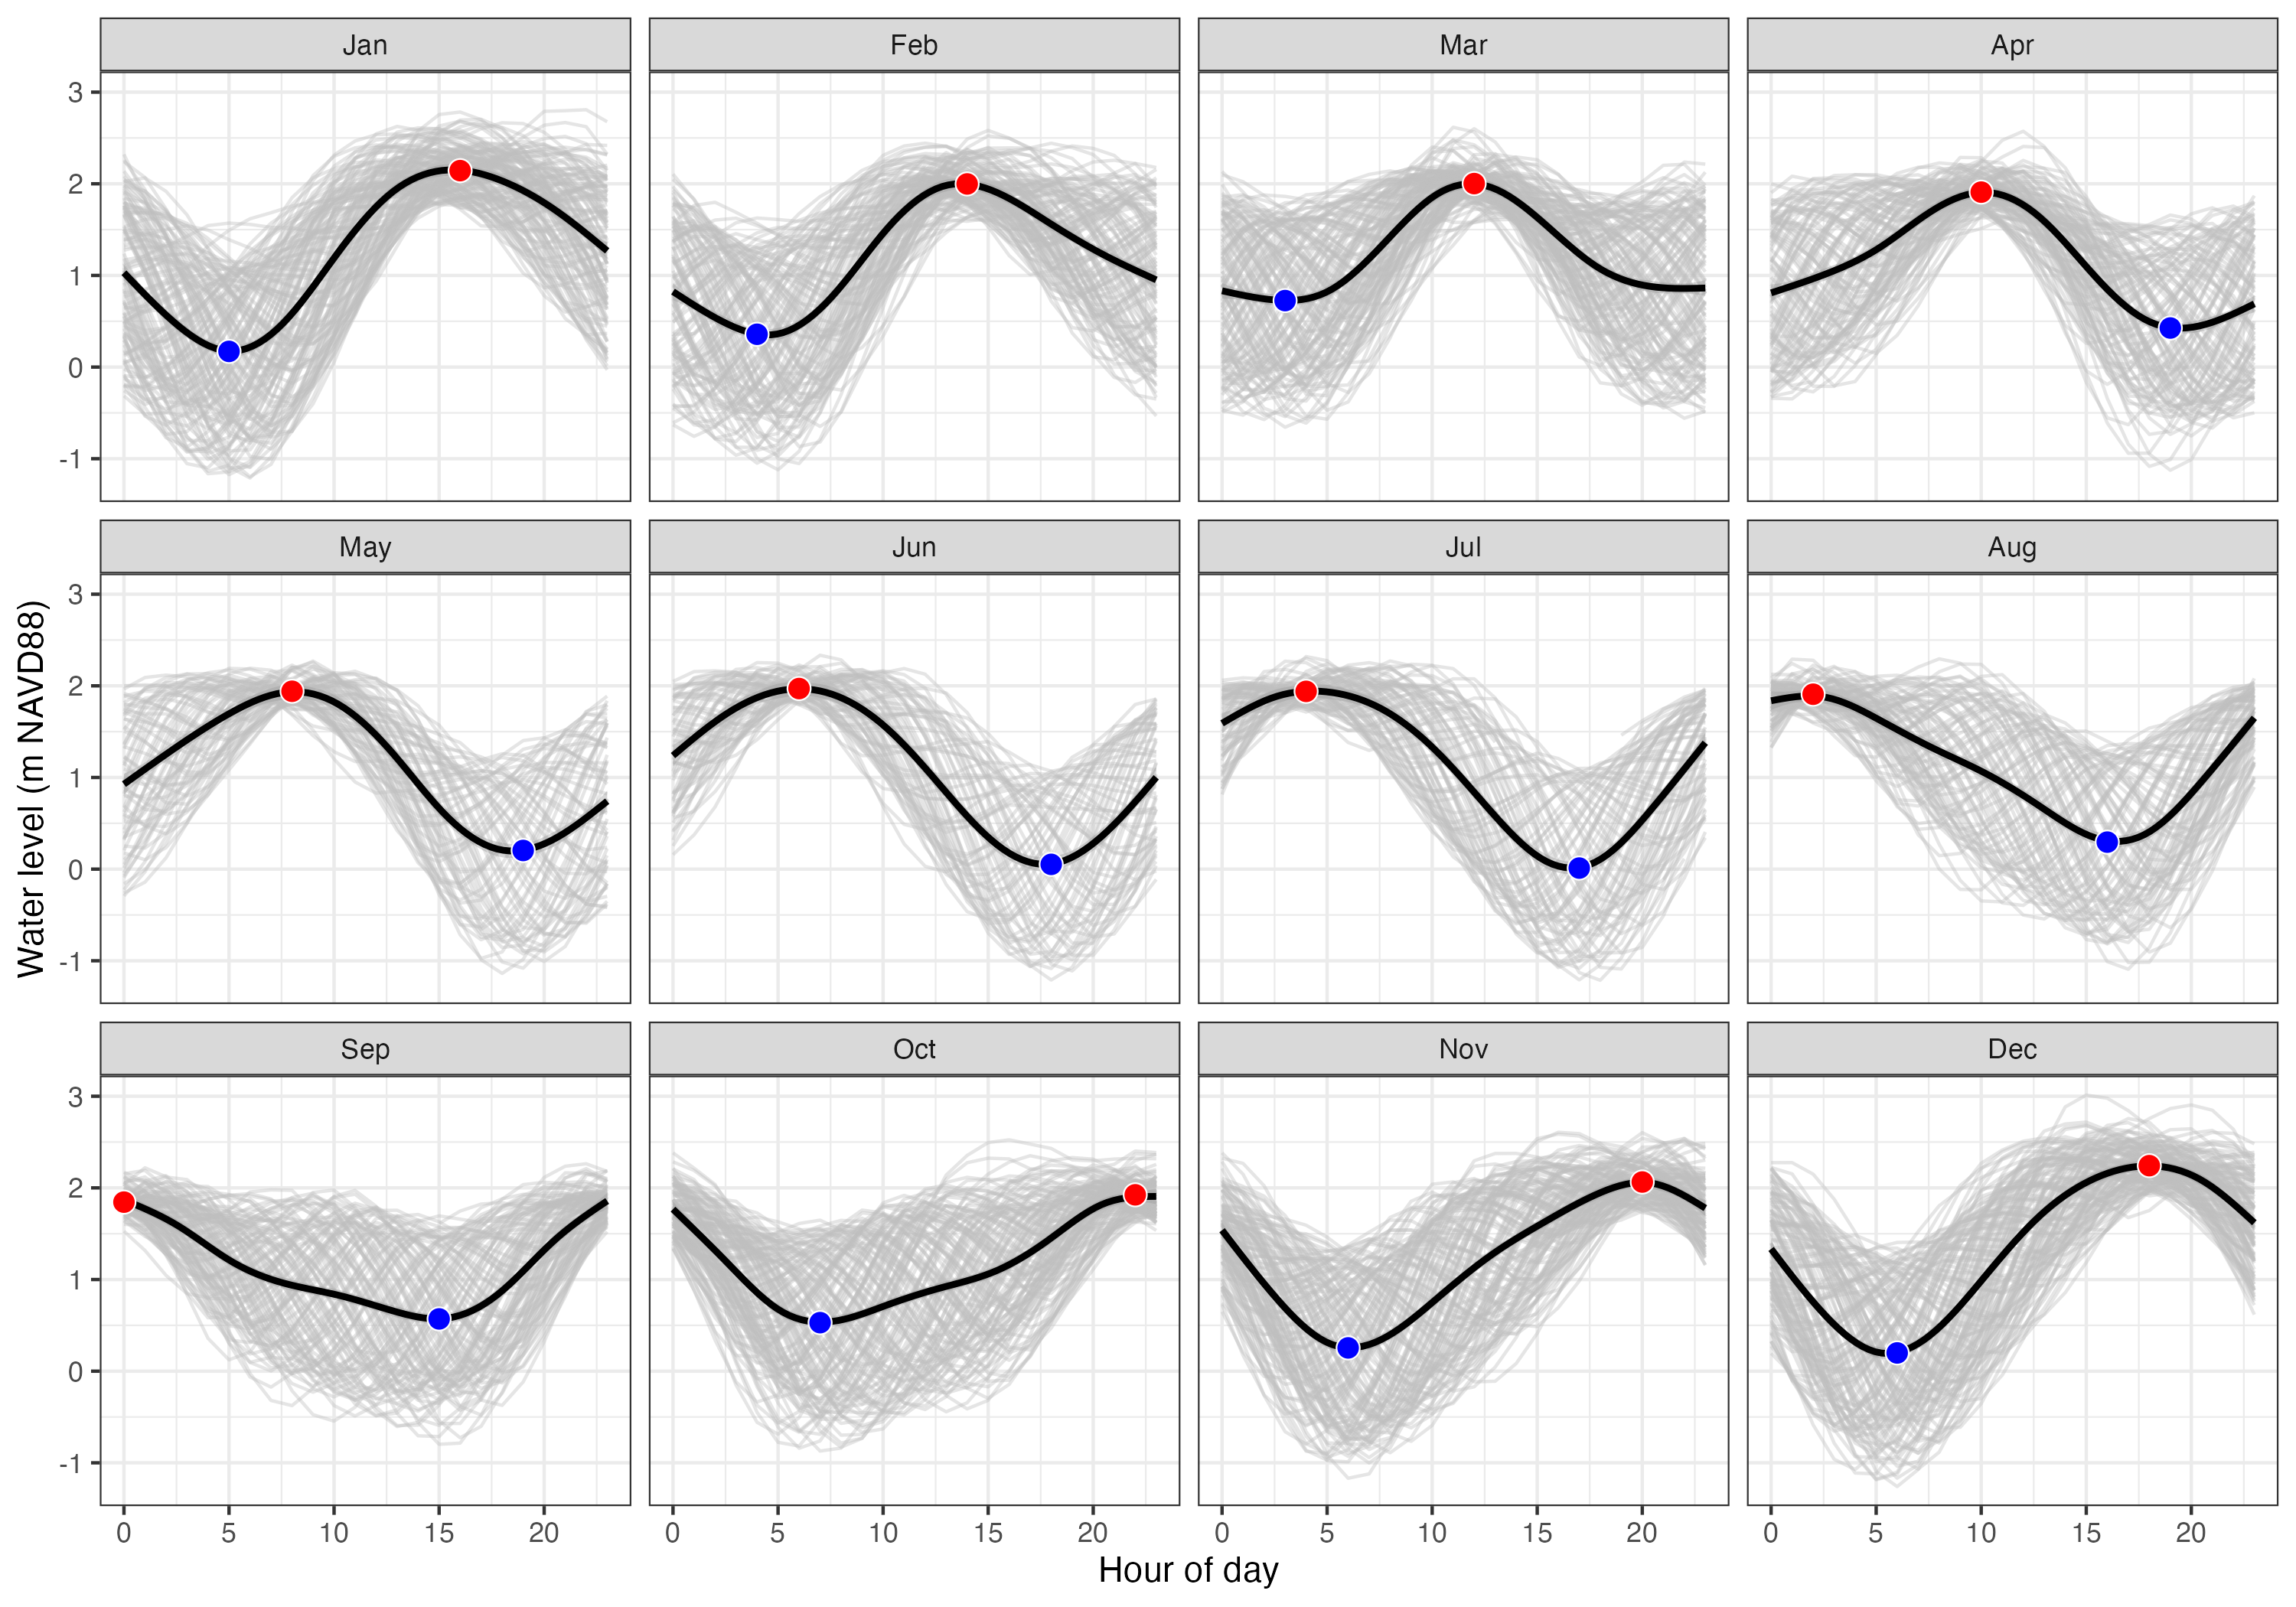
Seasonally, high tides generally occur between noon and the early afternoon in Jan-April, and generally get earlier, occuring near midnight in September. Low tides generally occur in the afternoon / early evening in the summer (Note that all times are in PST, and do not account for daylight savings).
Water Velocities
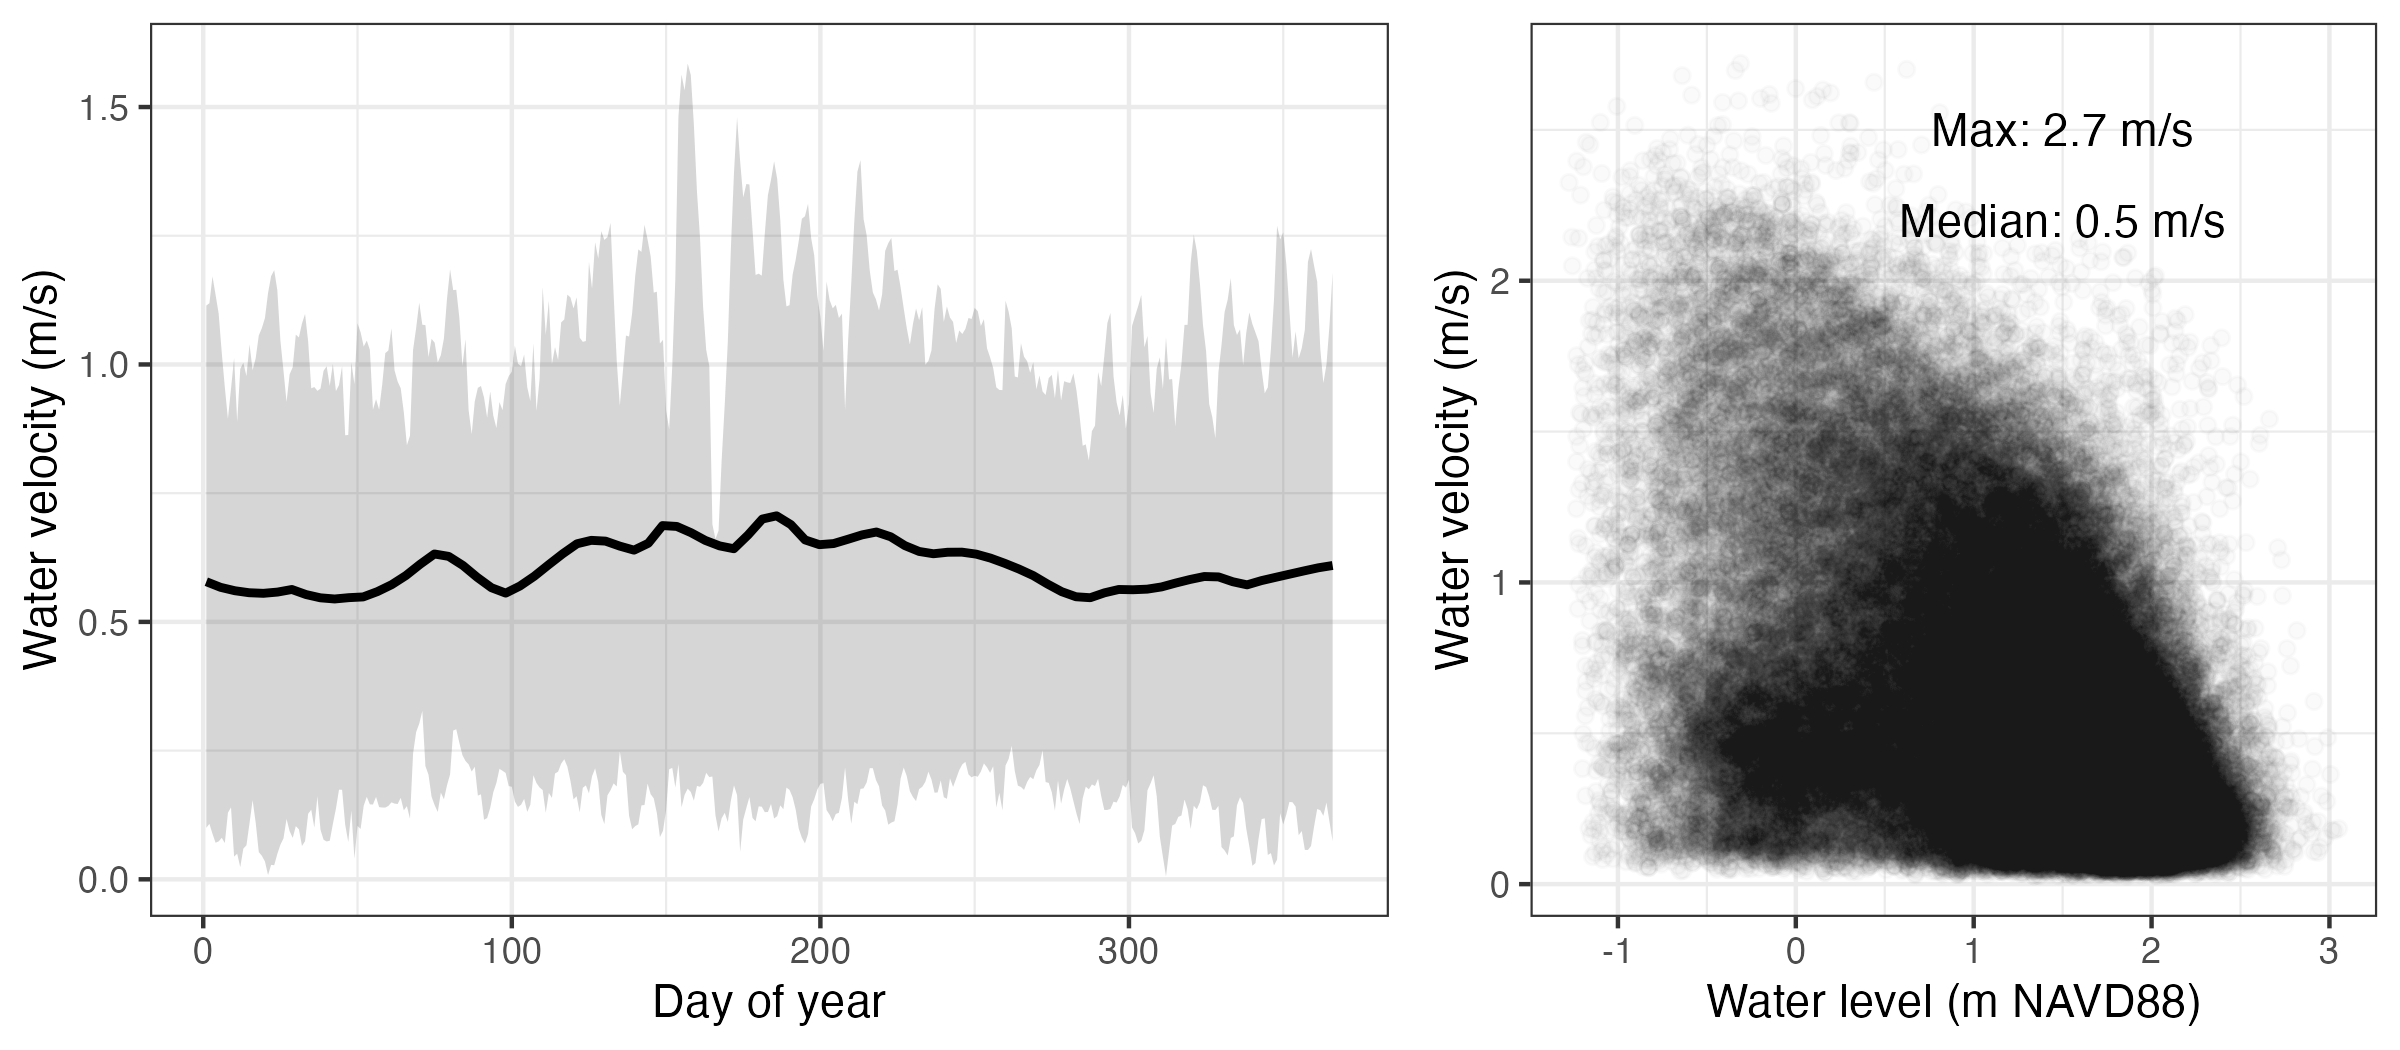
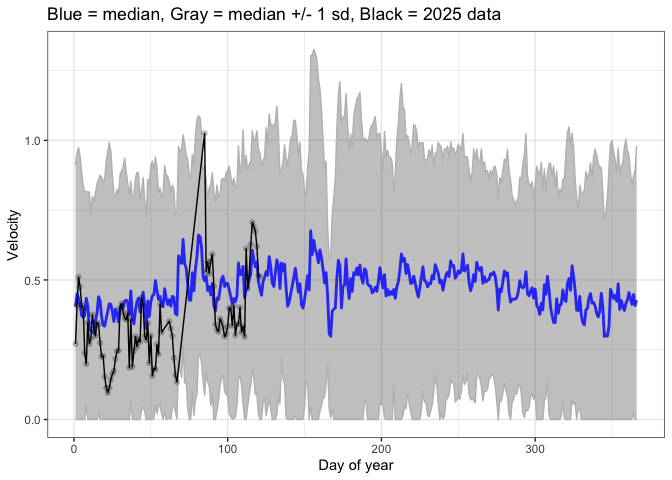
Water velocities average 0.5-0.7 m/s, but can increase up to 2.7 m/s during large tidal exchanges associated with king tides or extreme low tide events. The relationship between water velocities and water levels show velocities are generally higher at lower water levels, although there is considerable variation in this relationship.
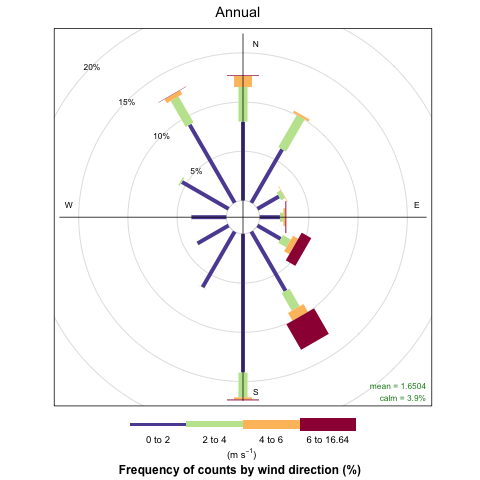
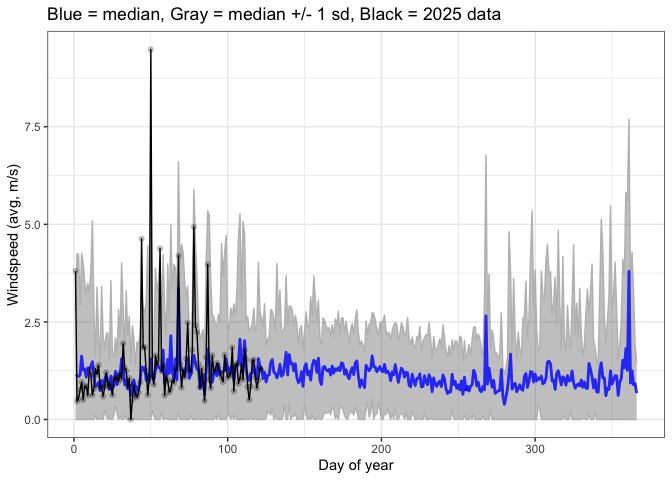
Annual Wind
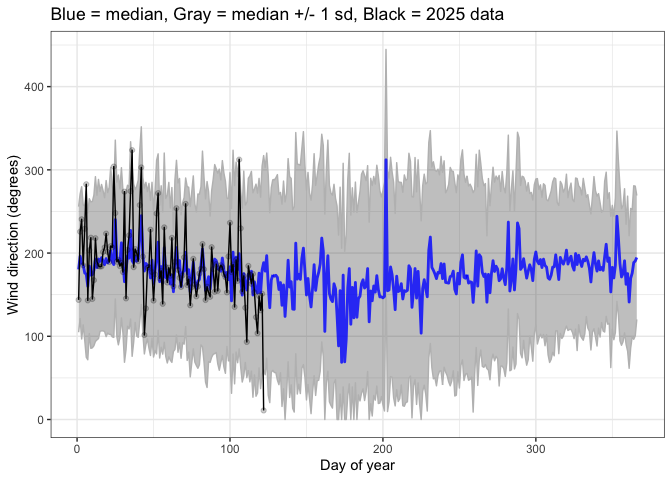
Wind speeds average 1.7 m/s, ranging from calm (4% of the time) to >16 m/s. Strongest winds are to the SE, and most common wind directions are S/SE followed by NW/N/NE.
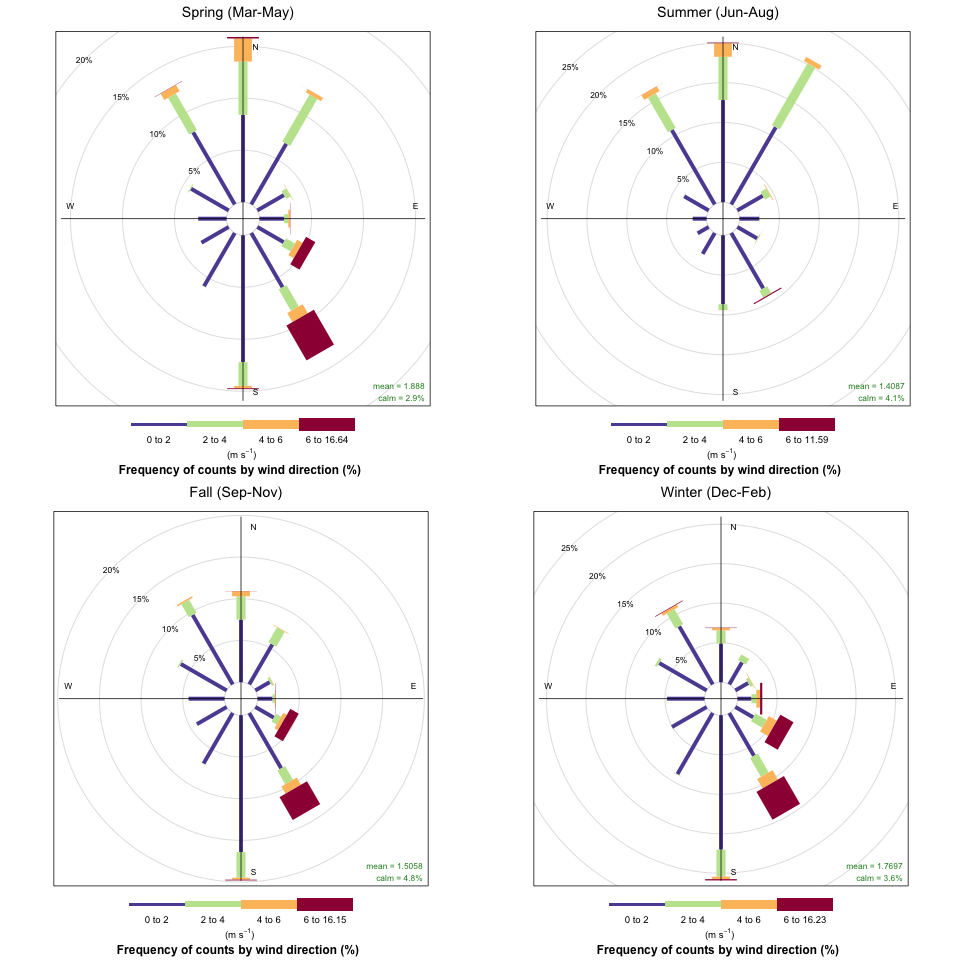
Seasonal Wind
- Spring - avg: 1.9 m/s, calm: 2.9%, most common: N/S, strongest: SE
- Summer - avg: 1.4 m/s, calm: 4.1%, most common: N, strongest: N
- Fall - avg: 1.5 m/s, calm: 4.8%, most common: S, strongest: SE
- Winter - avg: 1.8 m/s, calm: 3.6%, most common: S, strongest: SE
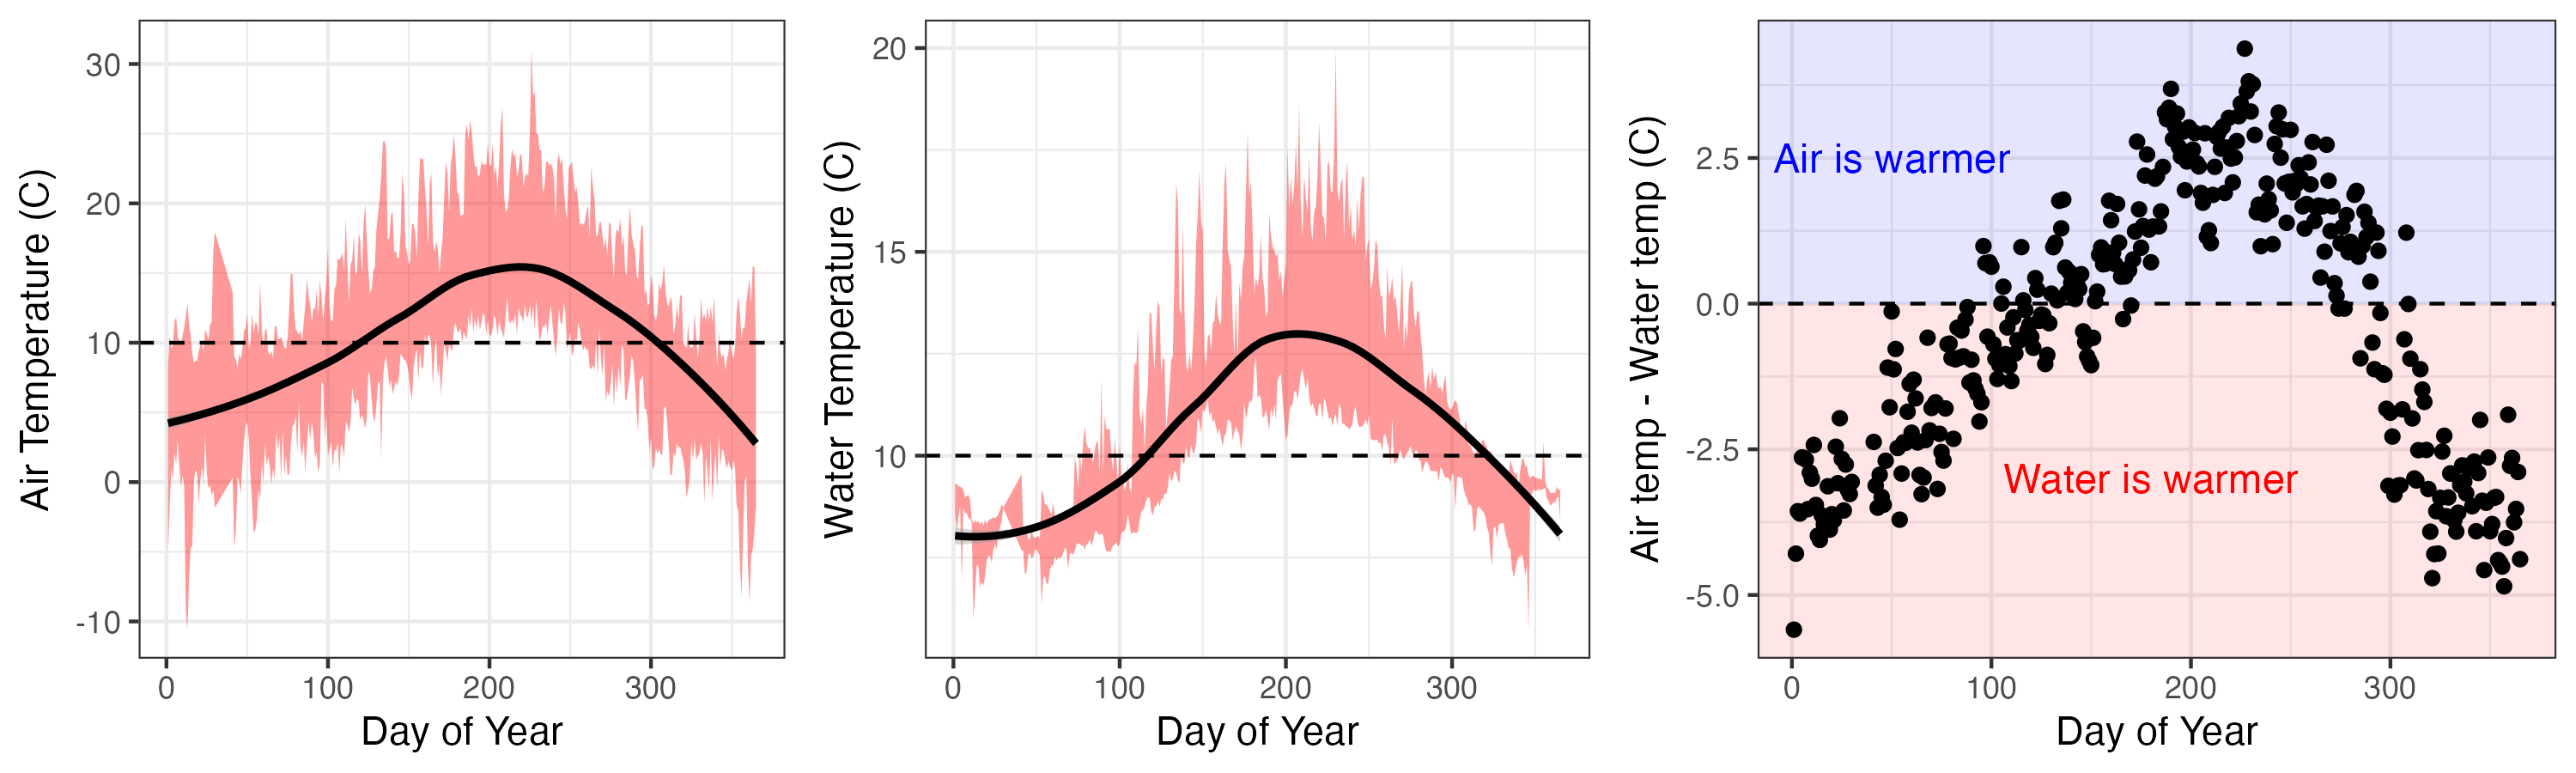
Air and Water Temperatures
Average air temperatures span ~5ºC during the winter to ~15ºC during the summer, with daily ranges (max - min) of ~5ºC during the winter to ~8ºC during the summer. Daily highs typically occur later in the spring (15:00) and summer (16:00) than fall and winter (14:00), while daily lows are consistently 4:00-5:00.
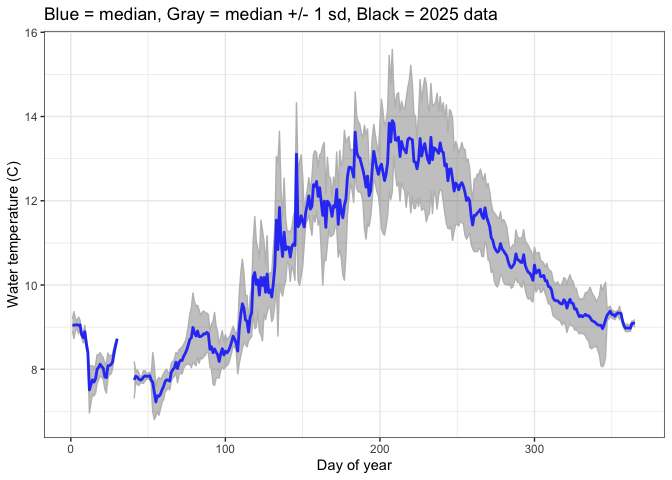
Water temperatures follow a similar pattern as air temperatures, and are generally warmer than air temperatures during the summer, and colder than air temperatures during the winter.
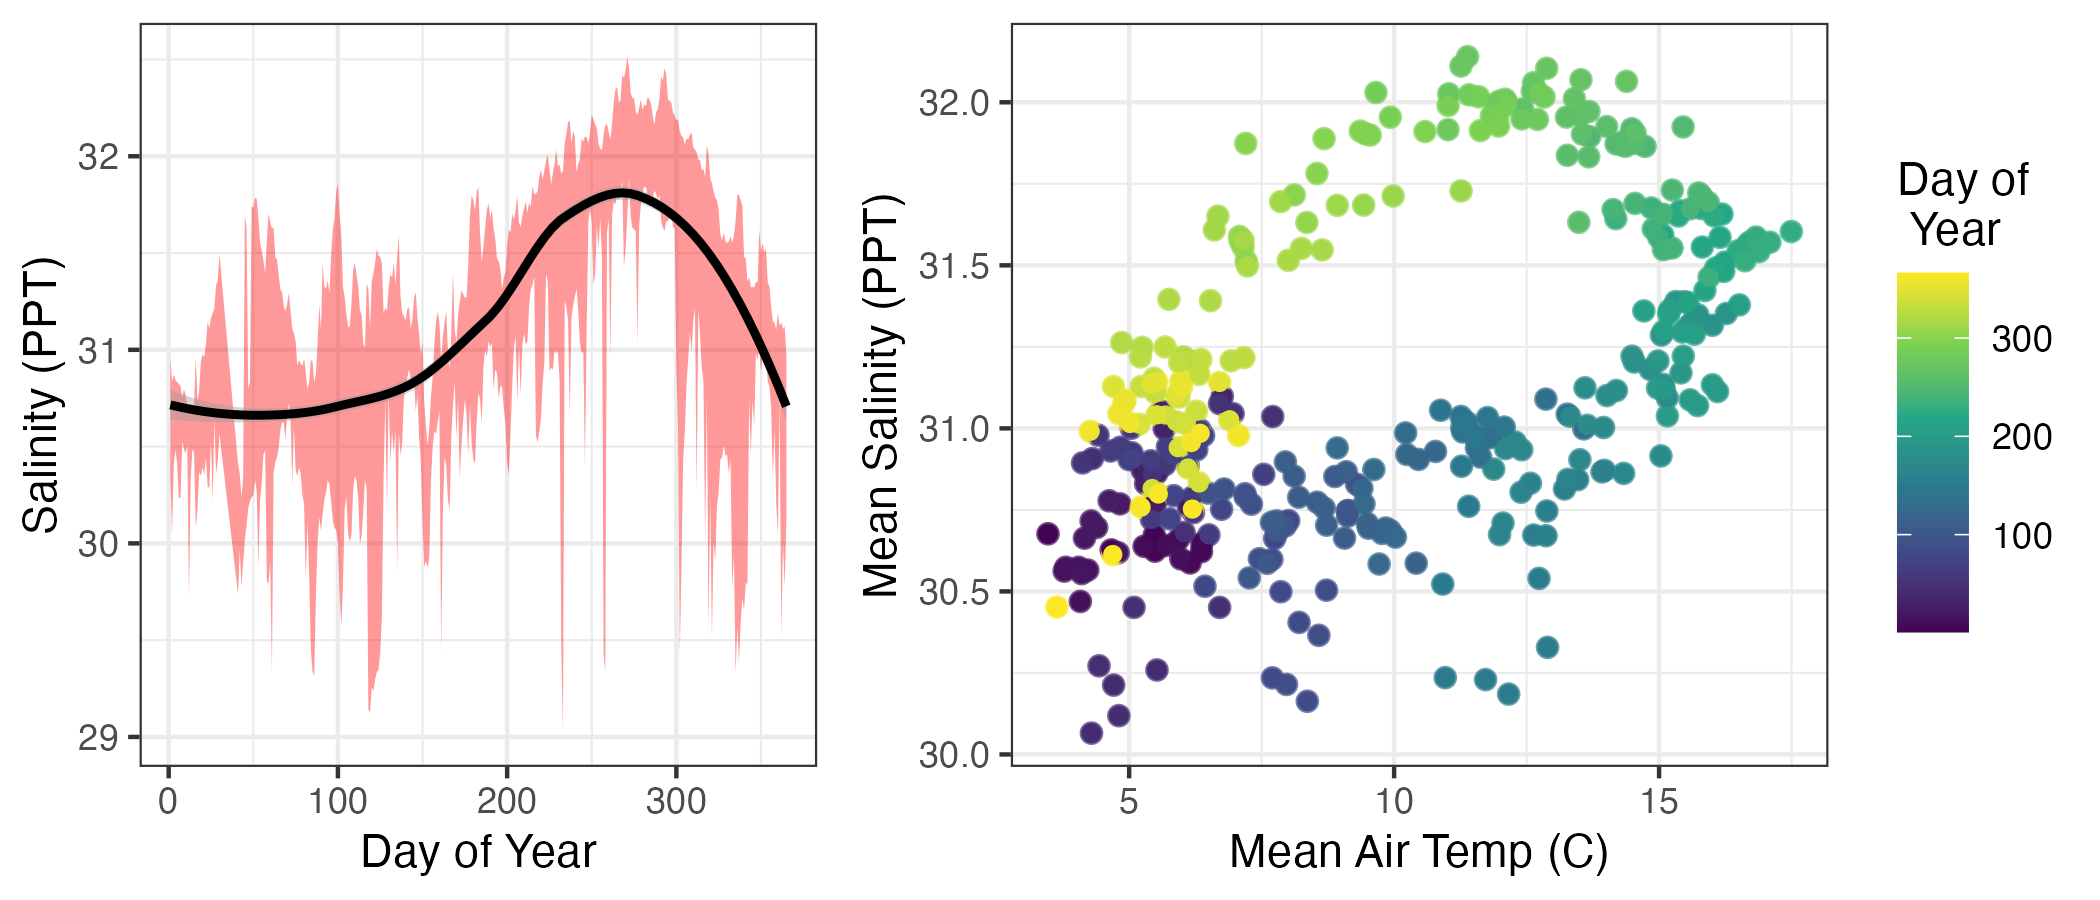
Salinity
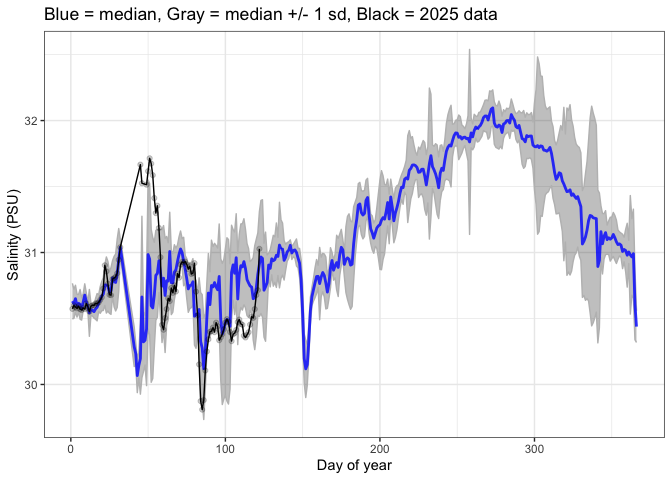
Salinity exhibits some seasonality, and is generally lower in the winter and spring, and generally higher in the sumemr and fall. This variation is relatively small for a coastal system, ranging from ~30-32 PPT through most of the year. The relationship between salinity and season can be viewed as a hysteresis loop in relation to air temperature.
Sequim Bay Natural Variability Envelopes
The following plots show natural variability for measured paramaters, based on four years of collected data from August 2021 to May 2025.
Water Temperature
Salinity
Windspeed (average)
Wind Direction
Tidal Water Levels
Tidal Velocities - ADCP
Baseline Carbonate Chemistry
This markdown summarizes currently available carbonate chemistry, focusing on total alkalinity (TA) and dissolved inorganic carbon (DIC) as key parameters. These data originated from Jessica Cross's LDRD work to capture natural variability envelopes of carbonate chemistry within Sequim Bay, and provide valuable baseline information.
Total Alkalinity as a Function of Salinity
Alkalinity and salinity are typically linearly related in marine environments as they are conservative quantities impacted by similar changes (like freshwater influence and biogeochemical processes). The alkalinity and salinity relationship in Sequim Bay was found to have an R2 of 0.71, suggesting minimal freshwater influence. While this relationship clearly varies, and does not necessarily account for seasonal or interannual variation, it provides a handy first estimate for TA.
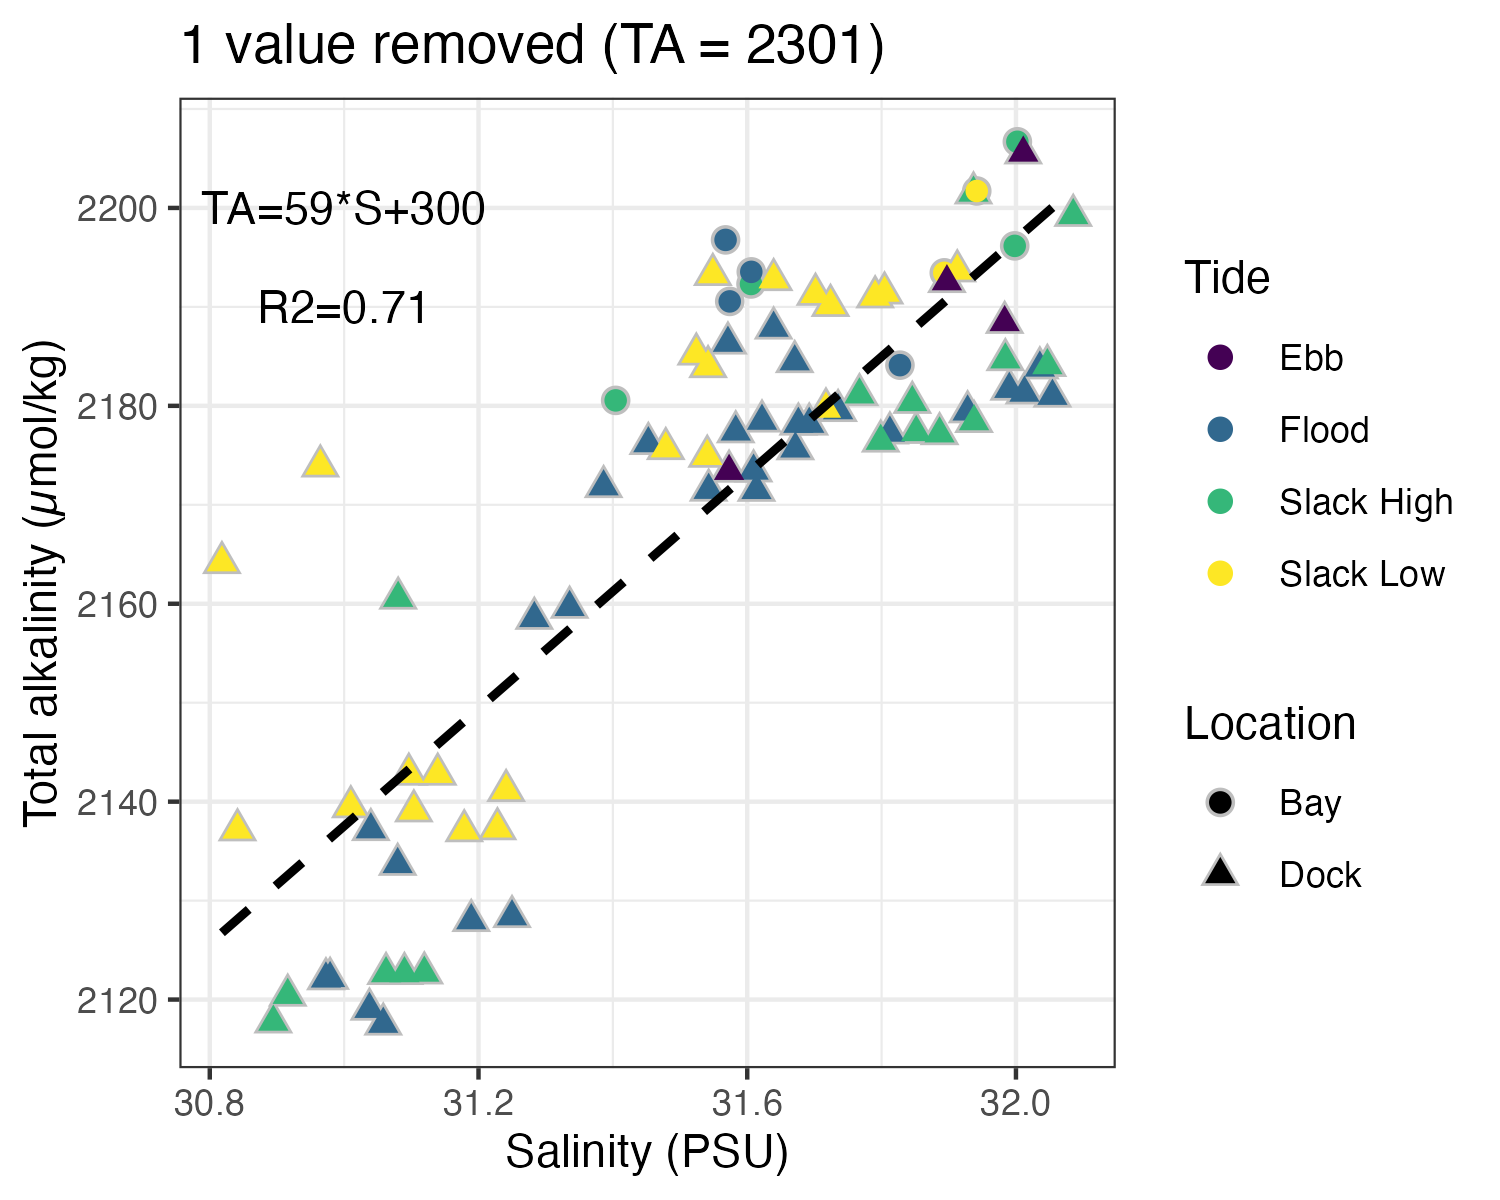
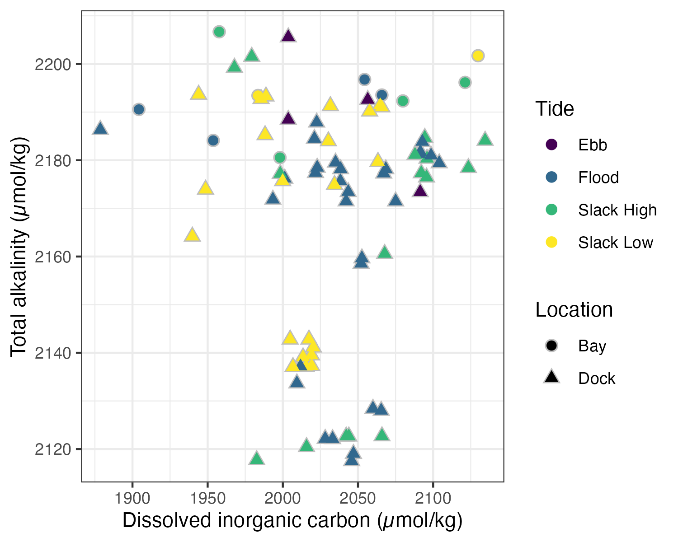
TA and DIC samples were collected from Sequim Bays inlet (PNNL-Sequim Pier) and from within Sequim Bay. Sequim Bay has minimal freshwater influence and is tidally driven. However, no correlation was observed between TA/DIC samples (dock (triangle) or bay (circle)) and tide stage (indicated by colors). It should be noted that two unique water masses were observed between the dock and the bay, highlighting varying conditions between the tidal channel and the bay.
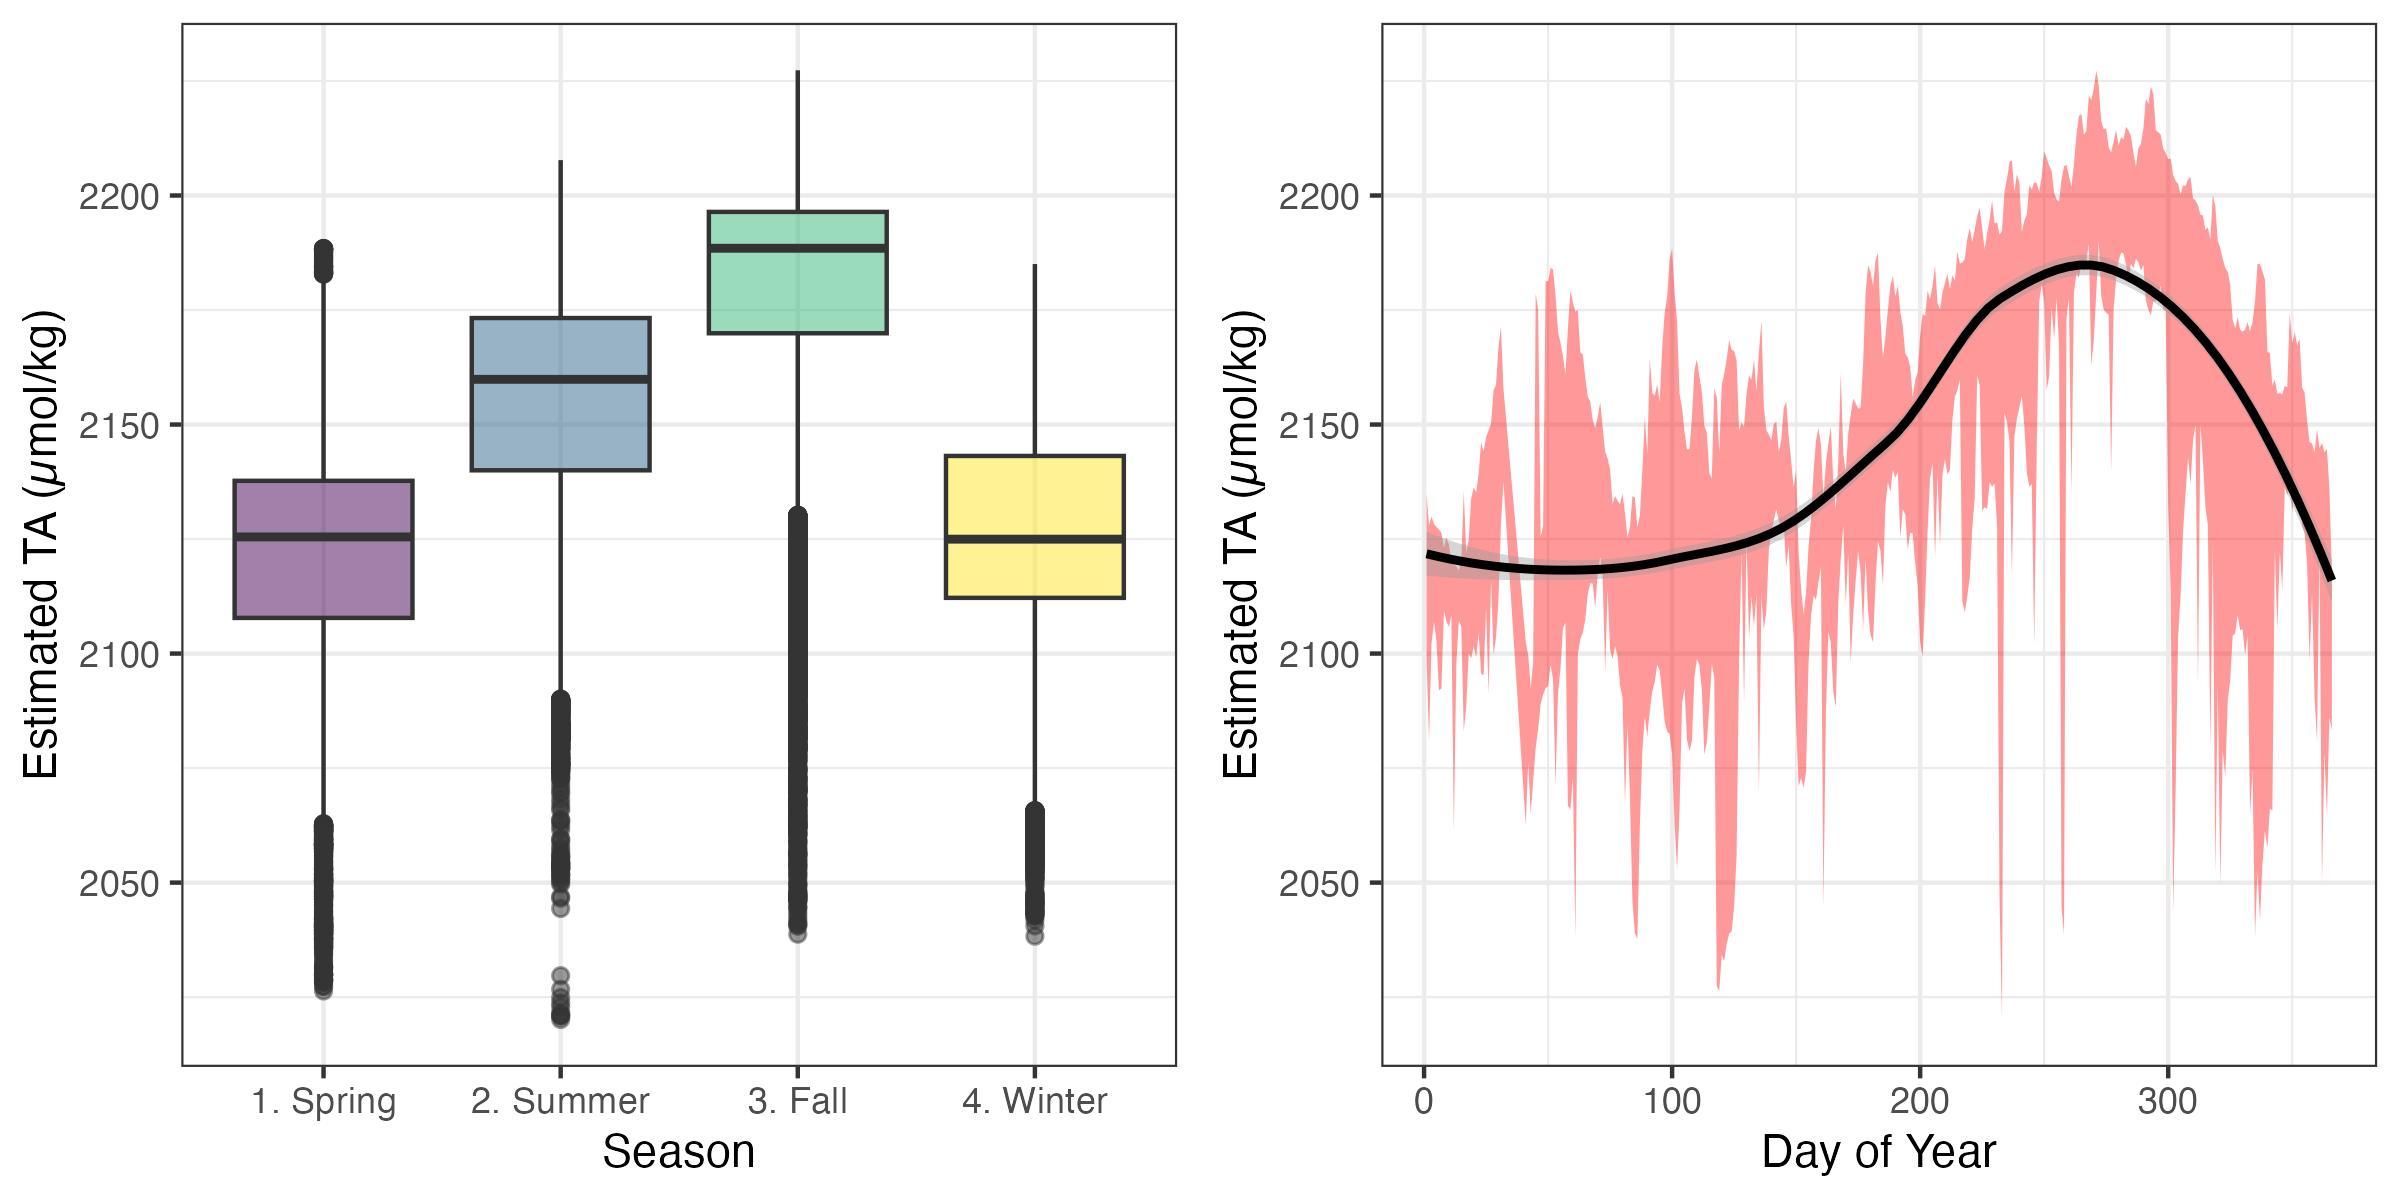
Estimated Seasonality of Total Alkalinity
Using this relationship, we can estimate TA based on salinity. Following salinity, estimated TA is highest in the fall and lowest during spring and winter, with a peak in late October.